|
Читайте также: |
A total of 48 patients received the assigned study treatment and no patients were withdrawn due to refusal, missed data or adverse effects during the study.
No significant differences in age, gender, height, weight, lean body weight, body weight index, and supramaximal current were found between the groups (Table 1).
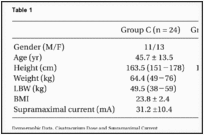
Table 1
Demographic Data, Cisatracurium Dose and Supramaximal Current
In group M, the lag time and onset time were significantly shorter than in group C (P < 0.05, Fig. 1). he median (ranges) lag time and onset time was 43.7 (30-83) vs. 68.5 (40-110), and 101.5 (75-225) vs. 150 (93-240) seconds in groups M and C, respectively. However, there were no significant differences of Recovery index, recovery time, clinical duration, and total recovery time in both groups (Fig. 2). Recovery index, recovery time, clinical duration, and total recovery time were 16.5 (7-27) vs. 16.0 (7-23), 40.7 (21-53) vs. 41.3 (31-49), 71.5 (44-89) vs. 78.50 (44-88), and 116.0 (77-138) vs. 118.1 (81-132) minutes in groups M and C, respectively.

Fig. 1
Lag time (LT) and onset time (OT). LT and OT were significantly shorter in group M than in group C. LT is the time in seconds from the start of cisatracurium injection until the first change of single twitch response. OT is the time until 95% depression ...

Fig. 2
Recovery characteristics. There were no significant differences between groups in all recovery findings. Total recovery time (TRT) is the time from the start of cisatracurium injection until TOF ratio = 0.9. Clinical duration (CD) is the time in minutes ...
Mean arterial pressure was more significantly increased in the MgSO4 group than in the control group at the time just after administration of MgSO4 (P < 0.05, Fig. 3). Heart rate showed no significant changes in both groups (Fig. 3). The concentrations of ionized magnesium were significantly more increased at the all time point (P < 0.05, Fig. 4).

Fig. 3
Mean arterial pressure (A) and heart rate (B). There were no significant differences between groups except mean arterial pressure increased immediately after administration of MgSO4. In the MgSO4 group (group M), patients received MgSO4 30 mg/kg in 0.9% ...

Fig. 4
The concentration of ionized magnesium. There were significant increases of the concentration of ionized magnesium in group M at all time points. In the MgSO4 group (group M), patients received MgSO4 30 mg/kg in 0.9% normal saline (total volume = 100 ...
Дата добавления: 2015-02-22; просмотров: 109 | Поможем написать вашу работу | Нарушение авторских прав |