The following table summarizes our personnel expenditures for the first three years, with compensation increasing from $50K the first year to $70K in the third. The detailed monthly personnel plan for the first year is included in the appendices.
| Personnel Plan | FY 2000 | FY 2001 | FY 2002 |
| Name or title | $0 | $0 | $0 |
| Other | $0 | $0 | $0 |
| Total People | |||
| Total Payroll | $0 | $0 | $0 |
Financial Plan
Financial Plan
The financial plan which follows summarizes information regarding the following items:
Important Assumptions.
Key Financial Indicators.
Break-Even Analysis.
Projected Profit and Loss.
Projected Cash Flow.
Projected Balance Sheet.
Business Ratios.
Important Assumptions
The financial plan depends on important assumptions, most of which are shown in the following table as annual assumptions. The monthly assumptions are included in the appendices.
Some of the more important underlying assumptions are:
We assume a strong economy, without major recession.
We assume the creation of Nunavut will not dramatically change the delivery of engineering services.
Interest rates, tax rates, and personnel burdens are based on conservative assumptions.
| General Assumptions | FY 2000 | FY 2001 | FY 2002 |
| Plan Month | |||
| Current Interest Rate | 10.00% | 10.00% | 10.00% |
| Long-term Interest Rate | 10.00% | 10.00% | 10.00% |
| Tax Rate | 16.25% | 15.00% | 16.25% |
| Sales on Credit % | 100.00% | 100.00% | 100.00% |
| Other |
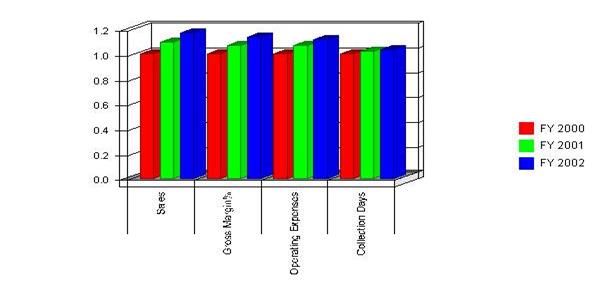
Key Financial Indicators
The following benchmark chart indicates our key financial indicators for the first three years. We foresee modest growth in sales and a marginal reduction in operating expenses for the years presented.
Benchmarks
Дата добавления: 2015-09-10; просмотров: 120 | Поможем написать вашу работу | Нарушение авторских прав |