Читайте также:
|
As a composite indicator, the Enabling Trade Index is a compilation of individual indicators into a single index. The structure of the Index reflects the main enablers of trade (see Figure#1. The Enabling Trade Index Framework ). The content of the Index is described in the table#1.
The Enabling Trade Index is composed of 4 main components, the subindexes:
A. Market access; B. Border administration;
C. Infrastructure; D. Operating environment.
The subindexes are subdivided into 7 ‘pillars’:
1) domestic market access;
2) foreign market access;
3) efficiency and transparency of border administration;
4) availability and quality of transport infrastructure;
5) availability and quality of transport services;
6) availability and use of ICTs;
7) operating environment.
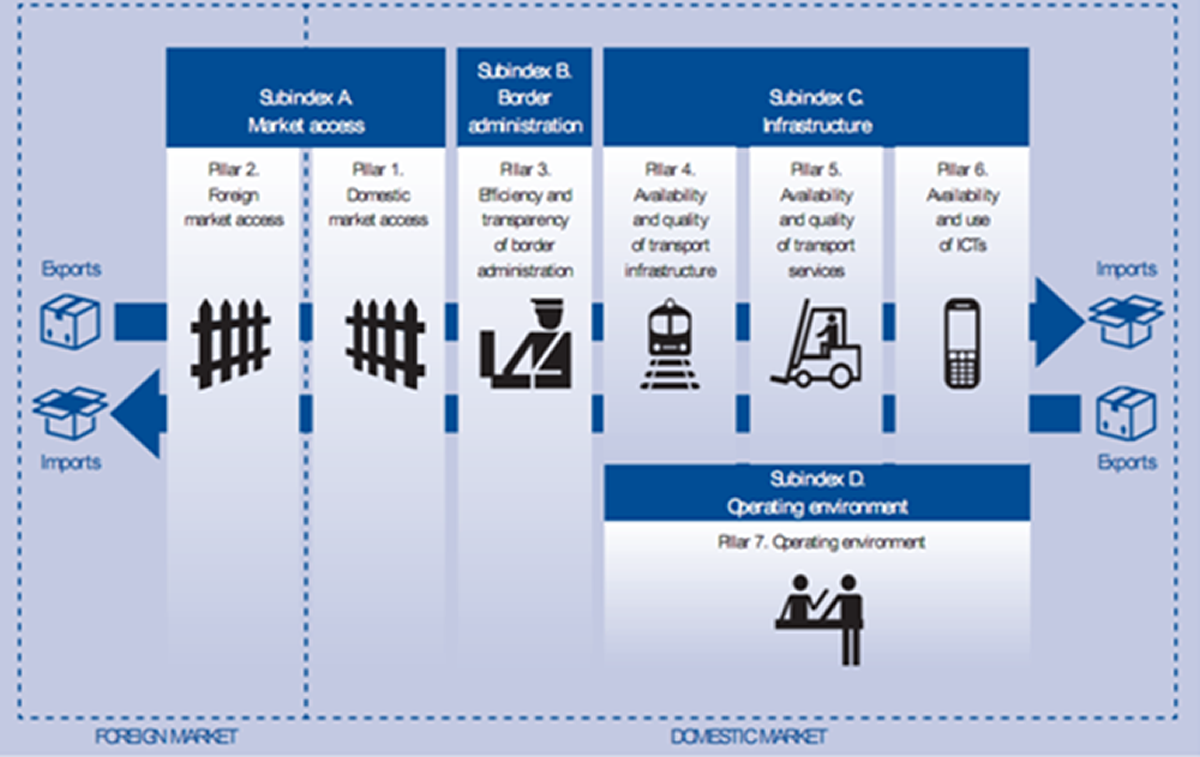
Figure#1. The Enabling Trade Index Framework
Each pillar is composed of a total of 56 indicators and subindicators.Indicators and subindicators are drawn from various sources. Pillar scores are computed as the arithmetic mean of the composing individual indicators, which are first transformed on a common scale ranging from 1 to 7, with 7 indicating the best possible outcome. Subindex scores correspond to the arithmetic means of the respective comprising pillars. Consequently, subindex and overall scores always range from 1 to 7.
Exercise. Please, calculate the Enabling Trade Index of Ukraine in 2014, filling in the table below.
| Score (1–7) | |
| Enabling Trade Index 2014 | |
| Subindex A: Market access | |
| Pillar 1: Domestic market access | 5.5 |
| Pillar 2: Foreign market access | 2.7 |
| Subindex B: Border administration | |
| Pillar 3: Efficiency & transparency of border administration | 3.6 |
| Subindex C: Infrastructure | |
| Pillar 4: Availability & quality of transport infrastructure | 3.7 |
| Pillar 5: Availability & quality of transport services | 4.2 |
| Pillar 6: Availability & use of ICTs | 3.9 |
| Subindex D: Operating environment | |
| Pillar 7: Operating environment | 3.7 |
Table#1 - The Enabling Trade Index Framework
| Subindex | Pillars | |
| Name | Description | |
| A. Market access. This subindex measures the extent and complexity of a country’s tariff regime, as well as tariff barriers faced and preferences enjoyed by a country’s exporters in foreign markets. | Pillar 1: Domestic market access (6 indicators) | The pillar assesses the level and complexity of a country’s tariff protection as a result of its trade policy. This component includes the effective trade-weighted average tariff applied by a country, the share of goods imported duty free and the complexity of the tariff regime, measured through tariff variance, the prevalence of tariff peaks and specific tariffs, and the number of distinct tariffs. |
| Pillar 2: Foreign market access (2 indicators) | The pillar assesses tariff barriers faced by a country’s exporters in destination markets. It includes the average tariffs faced by the country as well as the margin of preference in destination markets negotiated through bilateral or regional trade agreements or granted in the form of trade preferences. | |
| B. Border administration. This subindex assesses the quality, transparency and efficiency of border administration of a country. | Pillar 3: Efficiency and transparency of border administration (11 indicators) | The pillar assesses the efficiency and transparency of border administration. More specifically, it captures efficiency, transparency and costs associated with importing and exporting goods. It includes an assessment of the range and quality and comprehensiveness of key services offered by customs and related agencies, the average time, costs and number of documents required to, respectively, import and export goods. The pillar also assesses the time predictability of border procedures, as well as the transparency of the process, as measured by the availability and quality of information provided by border agencies and the prevalence of corruption |
| C. Infrastructure. This subindex assesses the availability and quality of transport infrastructure of a country, associated services, and communication infrastructure, necessary to facilitate the movement of goods within the country and across the border. | Pillar 4: Availability and quality of transport infrastructure (7 indicators) | This pillar measures the availability and quality of domestic infrastructure for each of the four main modes of transport: road, air, railroad and sea port infrastructures. Air connectivity and sea line connectivity are also assessed. |
| Pillar 5: Availability and quality of transport services (6 indicators) | A necessary complement to the previous one, this pillar assesses the availability and quality of transport services, including the presence and competencies of shipping and logistics companies in the country, and the ease, cost and timeliness of shipment. In addition, this pillar includes a measure of postal efficiency. | |
| Pillar 6: Availability and use of ICTs (7 indicators) | This pillar evaluates the availability and quality of information and communication technologies (ICTs) in a country, as proxied by the use of mobile telephony and Internet by the population at large, by companies for business transactions, and by the government for interacting with citizens. It also takes into account the quality of Internet access, as broadband access has become the norm to fully leverage the potential of the Internet. | |
| D. Operating environment.This subindex measures the quality of key institutional factors impacting the business of importers and exporters active in a country. | Pillar 7: Operating environment (17 indicators) | This pillar assesses the quality of a country’s operating environment, which significantly impacts the capacity of companies that export, import, trade and/or transport merchandise to do business. It assesses a country’s level of protection of property rights; the quality and impartiality of its public institutions, including of the judiciary in commercial disputes; the availability of finance, including trade finance; its openness to foreign participation in terms of foreign investment and labour; as well as the level of physical security approximated by the incidence of crime and terrorism. |
Paper work: Essay&Presentation (10 points)
Analysis of International Trade of Ukraine with _________ (country)
Enabling Trade Index: Ukraine VS ___________ (country)
Guidelines:
Part I. Analysis of International Trade of Ukraine with ____________ (country)
You are required to write an essay related to International Trade of Ukraine with one of the countries. One of the main requirement is to collect and process the statistical data related to the research question and interpret the results. Data analysis is important to get a positive grade. Don’t forget to make your forecast and final conclusion as well. Please, prepare to make a presentation of your research work at one of the lessons. The country and the date of presentation must be agreed with the lecturere in advance.
Your paper work is supposed to be an analitical research of bilateral trade of Ukraine and agreed country including related numerical data, charts and comments. Please, pay your special attention to the following content parts of your research:
1. Main indicators of international trade of the chosen country: trade balance, reserve assets (total and per capita), gross external debt (total and per capiuta). Please, compare them with those of Ukraine.
2. The share and place of the partner-country in the total export and import of Ukraine as well as the share and place of Ukraine in the total export and import of the partner-country.
3. Main exported and imported products, their shares in the total export and import of these products.
4. Dynamics of main indicators of bilateral trade: export, import, trade balance, trade turnover.
5. Your forecast as to the prospectives and tendencies of bilateral trade of Ukraine with agreed country.
Part II. Enabling Trade Index: Ukraine VS ___________ (country)
In the second part of your paper work, please, compare the extent to which Ukraine and chosen country facilitates the free trade of goods over borders. Please, consider the question by comparing the Enabling Trade Indexes of the countries as follows:
1. Total ranks and scores of the countries in 2014; nearest “neighbours”; dynamics of the ranks and scores in 2010, 2012, 2013
2. Country/Economy profiles in 2014 (see pages 45, 49, 306 of the Global Enabling Trade Report-2014). Please, consider and compare the indicators given on the page 1 of the profiles: Key indicators, Value chain indicators, Enabling Trade Index 2014, The most problematic factors for trade.
3. Overall conclusions.
Дата добавления: 2015-09-11; просмотров: 155 | Поможем написать вашу работу | Нарушение авторских прав |
|